pipx install mcp-auditFeatures
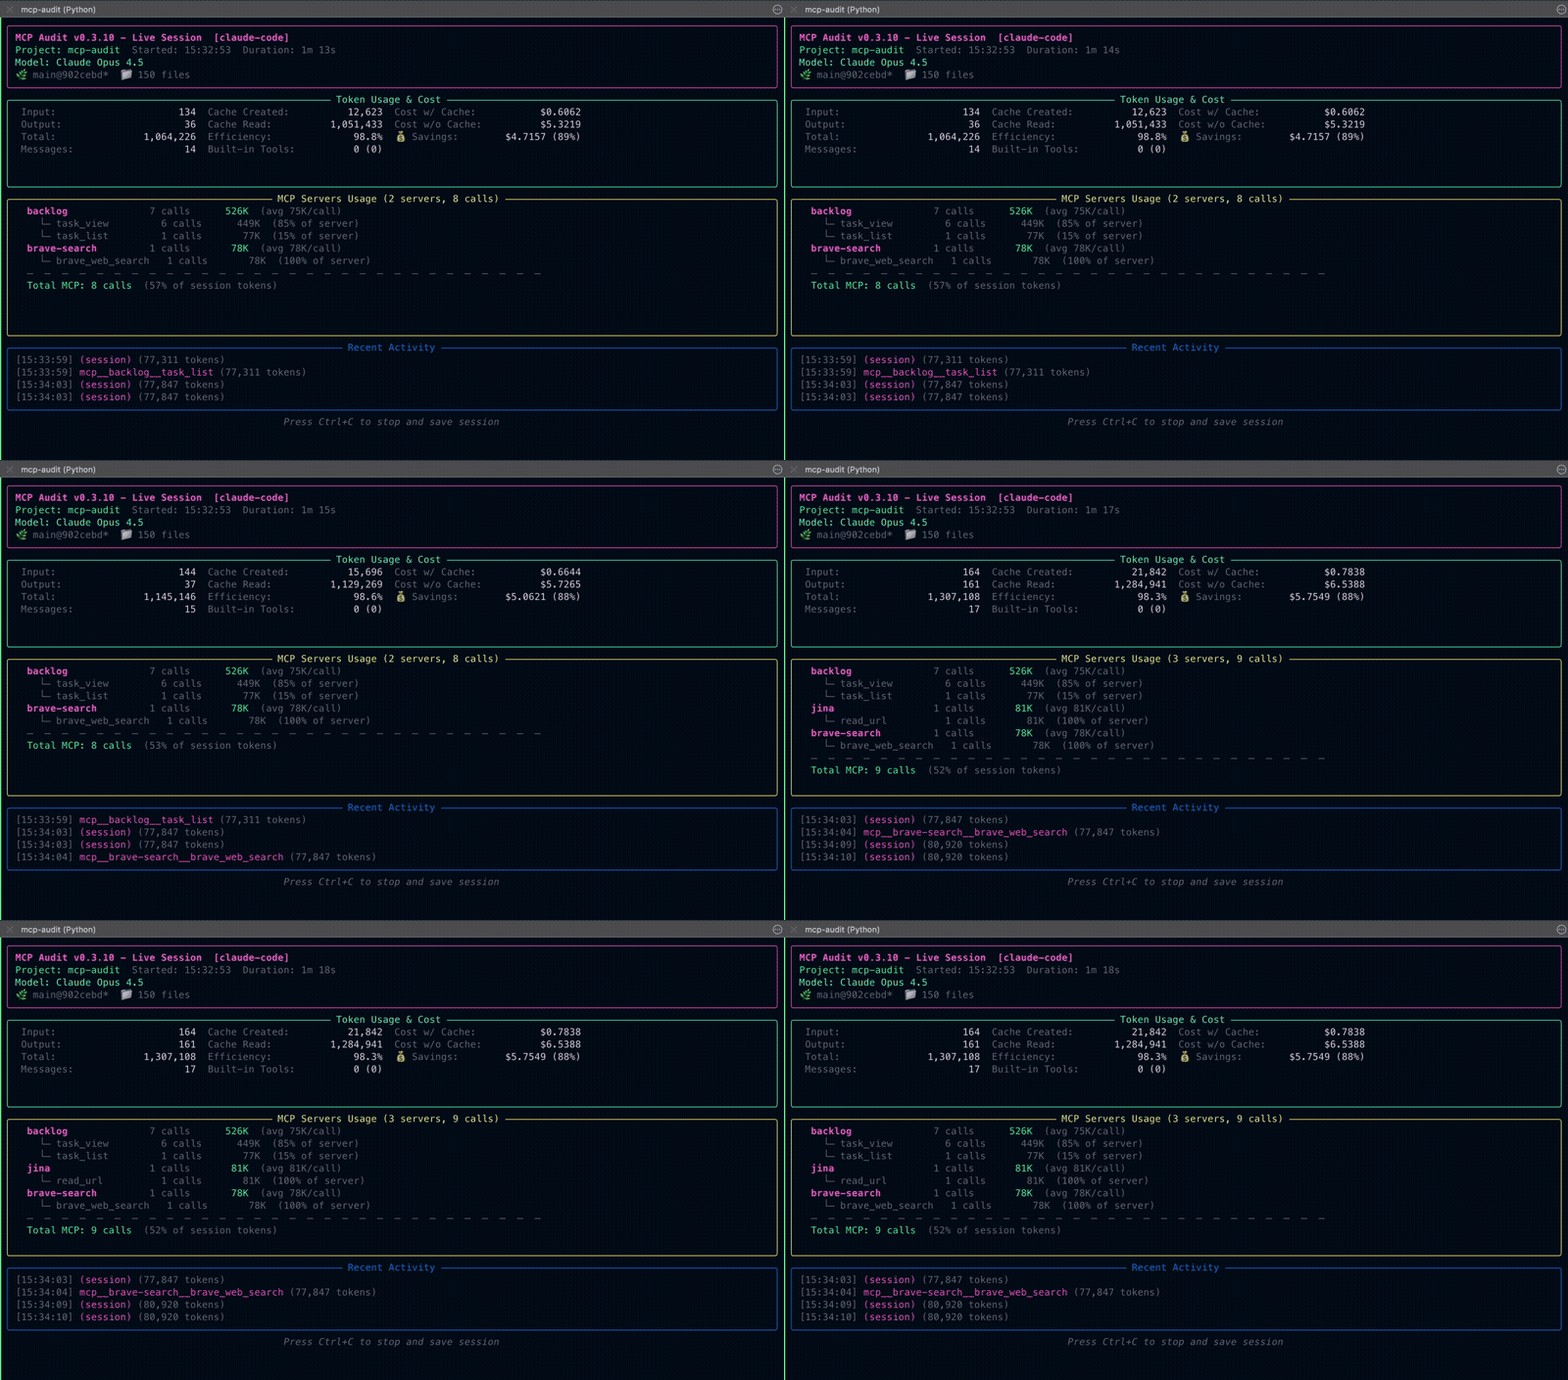
- Real-time token tracking across Claude Code, Codex CLI, and Gemini CLI
- MCP Server Mode with 8 tools for natural language access
- Dashboard with Live Monitor, Recommendations, and Command Palette
- Smell Detection - 12 efficiency patterns (HIGH_VARIANCE, CHATTY, etc.)
- Zombie Tool detection for unused MCP tools
- Multi-model cost tracking with dynamic pricing (2,000+ models)
- Context tax analysis showing per-server schema overhead
- AI Export for session analysis with your preferred AI assistant
- Theming support (Catppuccin Mocha/Latte, High Contrast)
- 100% local - no proxies, no cloud uploads
Why I Built This
I kept watching my Claude Code sessions compact unexpectedly. Tokens were disappearing somewhere, but I had no visibility into what was happening. The culprit? MCP tools. Large schemas eating context on every turn. Verbose tool outputs adding up. Chatty tools making redundant calls. But without instrumentation, I was flying blind. MCP Audit was born from this frustration. It's a passive observer that watches your session in real-time, showing you exactly where your tokens go. No proxies, no interception, no cloud — just visibility. Now when a session compacts early, I know why. When a tool is expensive, I see it immediately. When an MCP server has bloated schemas, I can fix it.
The Problem
MCP tools and servers often generate hidden token overhead—from schema size, payload spikes, and inefficient tool patterns. These issues cause:
- Early auto-compaction — sessions end prematurely
- Slow agent performance — large contexts increase latency
- Unexpected cost increases — tokens add up faster than expected
- Context window exhaustion — hitting limits before finishing work
Who It’s For
| 🛠️ The Builder | 💻 The Vibecoder |
|---|---|
| ”Is my MCP server too heavy?" | "Why did my session auto-compact?” |
| You build MCP servers and want visibility into token consumption. | You use Claude Code daily and hit context limits without knowing why. |
| You need: Per-tool token breakdown, usage trends. | You need: Real-time cost tracking, session telemetry. |
Demo

Real-time token tracking & MCP tool profiling — understand exactly where your tokens go.
What to Look For
Once you’re running MCP Audit, watch for these patterns:
- Context Tax — Session starts with 10k+ tokens before you type anything (large schemas)
- Payload Spike — Single tool call consumes far more tokens than expected
- Zombie Tool — Tool in schema but never called (wasting schema tokens)
- Auto-Compaction Trigger — Conversation compacts unexpectedly early
Transparency
What MCP Audit accesses: Your local session logs and artifacts only.
What Little Bear Apps sees: Nothing. All data stays on your machine.
What third parties see: PyPI sees download stats. GitHub sees repo activity. That’s it.
Network access: By default, fetches model pricing from LiteLLM API (cached 24h). No usage data is sent. Can be disabled in config.
Roadmap
v1.1.0 — MCP Profiler
Schema efficiency metrics, tool coverage analysis, variance/spike detection, and profiling infrastructure. Theme: 'See the Numbers'
v1.2.0 — Ollama CLI + Platform Expansion
Ollama CLI via API proxy, goose adapter, Cursor adapter, AGENTS.md parsing. Theme: 'More Platforms'
v0.5.0 — Insight Layer
Smell detection, zombie tools, data quality, AI export MVP
v0.6.0 — Multi-Model Intelligence
Multi-model tracking and dynamic pricing infrastructure Theme: Multi-Model Intelligence Scope: - Multi-Model Per-Session Tracking (early version) - Dynamic Pricing via LiteLLM (with TOML fallback) - Static Cost Tracking (MCP schema context tax) - Schema v1.6.0 with models_used, model_usage, static_cost Note: Ollama CLI support moved to v0.6.1 (requires API proxy approach) Dependencies: v0.5.0 data quality system
v0.7.0 — UI Layer
TUI session browser, pinning, sorting, accuracy display
v0.8.0 — Analysis Layer
Expanded smells, improved AI export, recommendations
v0.9.0 — Polish + Stability
Documentation, examples, API cleanup, schema v1.0.0
v1.0.0 — MCP Server Mode
MCP Server Mode with 8 tools, Best Practices guidance system, Config Analysis, enhanced security with CREDENTIAL_EXPOSURE smell detection, and comprehensive integration documentation.
v0.6.1
CANCELLED - Ollama CLI moved to v1.1.0 (post-1.0 release)
v0.6.2
Features shipped in v0.9.1 (see #53)